Spatial Data Analysis of Civilian Harm in Ukraine
Recently I came across a new data source from the OSINT group Bellingcat, based on incidents in Ukraine that have resulted in potential civilian harm. This data began collection on February 24, 2022, and intends to be a living document that will continue to be updated as long as the war persists. Therefore, this data is not an exhaustive list of civilian harm in Ukraine but rather a representation of all incidents that Bellingcat has collected and determined the exact locations.
So I tried to apply my Spatial Data Science skills to extract statistical insights and produce a meaningful cartographic visualization.
All computations were made in the Jupyter notebook, and I really like Jupyter for its ability to represent your work without additional storytelling in the article.
See source code (jupyter notebook) in repo and welcome to discover.
Table of contents
Required modules
import pandas as pd
import geopandas as gpd
import json
import plotly.express as px
import plotly.graph_objects as go
import contextily as cx
import folium
from folium.plugins import HeatMap
Importing and exploring the data
Importing json file
fp = '../data/ukr-civharm-2022-05-24.json'

with open(fp, 'r') as file:
     data = json.loads(file.read())
Flatten nested JSON structures to pandas DataFrame
incidents_df = pd.json_normalize(data, record_path='filters', meta=['id', 'date', 'latitude', 'longitude', 'location', 'description'])incidents_df.head(2)| key | value | id | date | latitude | longitude | location | description | |
|---|---|---|---|---|---|---|---|---|
| 0 | Type of area affected | Residential | CIV0001 | 02/24/2022 | 49.85005 | 36.659031 | Chuhuiv, south of Kharkiv | Apartment block hit. Crater is very large, pos... |
| 1 | Weapon System | Unknown | CIV0001 | 02/24/2022 | 49.85005 | 36.659031 | Chuhuiv, south of Kharkiv | Apartment block hit. Crater is very large, pos... |
Data munging
incidents_df = incidents_df[incidents_df['key'] == 'Type of area affected'].rename(columns={'value': 'area_type'}).reset_index()columns = [
'id',
'date',
'latitude',
'longitude',
'location',
'area_type',
'description'
]incidents_df = incidents_df[columns]incidents_df[["latitude", "longitude"]] = incidents_df[["latitude", "longitude"]].apply(pd.to_numeric)incidents_df['date'] = pd.to_datetime(incidents_df['date'])Exploring the data
incidents_df.head(2)| id | date | latitude | longitude | location | area_type | description | |
|---|---|---|---|---|---|---|---|
| 0 | CIV0001 | 2022-02-24 | 49.850050 | 36.659031 | Chuhuiv, south of Kharkiv | Residential | Apartment block hit. Crater is very large, pos... |
| 1 | CIV0002 | 2022-02-24 | 48.748564 | 30.218515 | Uman | Commercial | Civillians hit by what appears to have been ar... |
incidents_df.info()<class ‘pandas.core.frame.DataFrame’>
RangeIndex: 456 entries, 0 to 455
Data columns (total 7 columns):
# Column Non-Null Count Dtype
— ------ -------------- -----
0 id 456 non-null object
1 date 456 non-null datetime64[ns]
2 latitude 456 non-null float64
3 longitude 456 non-null float64
4 location 456 non-null object
5 area_type 456 non-null object
6 description 456 non-null object
dtypes: datetime64ns, float64(2), object(4)
memory usage: 25.1+ KB
Statistical analysis
Analysing civilian harm by type of affected area
incidents_by_type = incidents_df.groupby('area_type').size()incidents_by_type = incidents_by_type.to_frame(name='n_events').reset_index()incidents_by_type.sort_values(by='n_events', ascending=False)| area_type | n_events | |
|---|---|---|
| 7 | Residential | 200 |
| 1 | Commercial | 52 |
| 9 | Undefined | 49 |
| 8 | School or childcare | 43 |
| 4 | Industrial | 35 |
| 3 | Healthcare | 32 |
| 0 | Administrative | 20 |
| 6 | Religious | 17 |
| 2 | Cultural | 7 |
| 5 | Military | 1 |
fig = px.pie(incidents_by_type, values='n_events', names='area_type', title='Civilian harm by type of affected area',
             hover_data=['n_events'], labels={'n_events':'Number of incidents'})

fig.update_traces(textposition='inside', textinfo='percent+label')
fig.update_layout(uniformtext_minsize=12, uniformtext_mode='hide', width=800, height=600)

fig.show()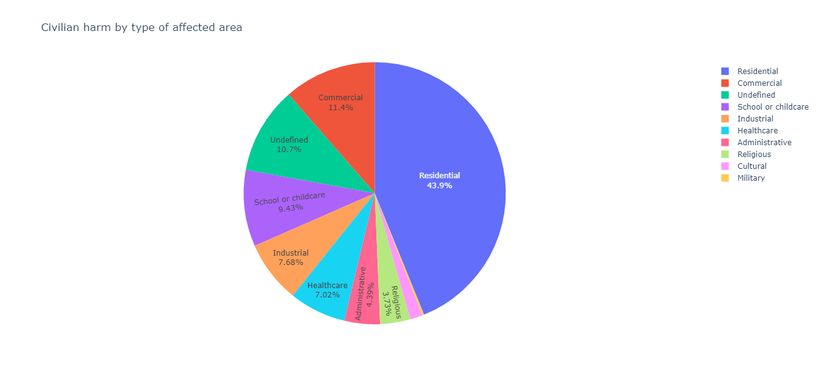
Analysing civilian harm by date
incidents_by_day = incidents_df.groupby('date').size().to_frame(name='n_events').reset_index()fig = px.line(incidents_by_day, x='date', y='n_events', title='Number of incidents per day', labels={'n_events':'Number of incidents'})
fig.show()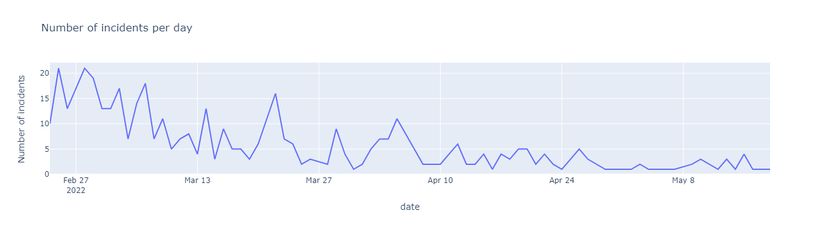
fig = px.bar(incidents_by_day, x='date', y='n_events', color='n_events')

fig.show()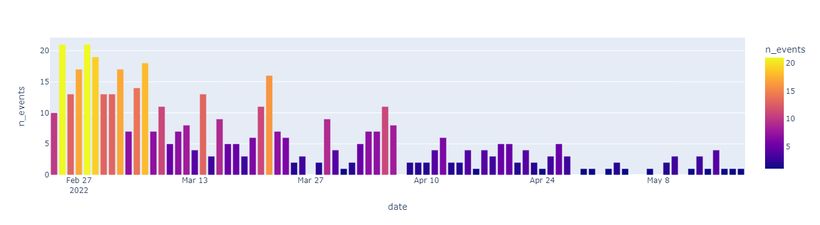
Geospatial dimension
Converting to a geospatial dataset
geo_incidents_df = gpd.GeoDataFrame(incidents_df, geometry=gpd.points_from_xy(incidents_df['longitude'], incidents_df['latitude']), crs="EPSG:4326")geo_incidents_df.to_crs(epsg=3857, inplace=True)ax = geo_incidents_df.plot(figsize=(20,10))
cx.add_basemap(ax)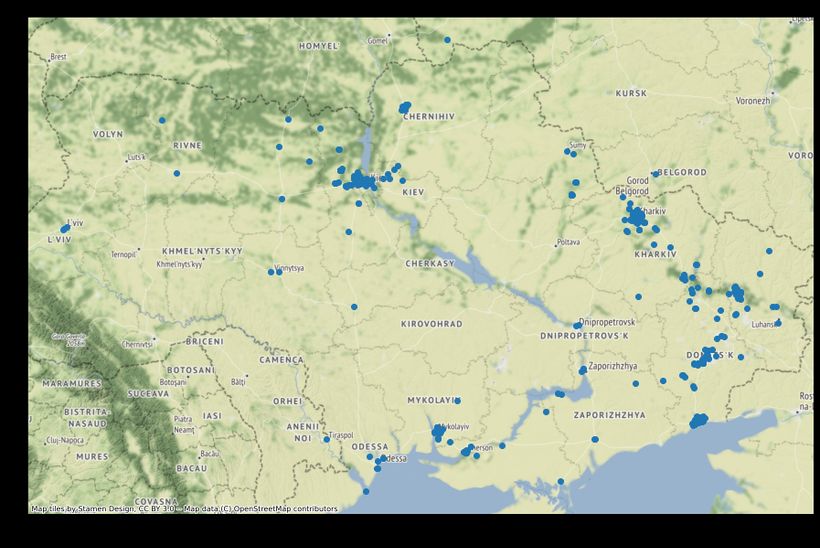
From the map above, we can define that few points are outside Ukraine.
Combining with regions of Ukraine
I downloaded the publicly available regions reference from humdata.org (Ukraine - Subnational Administrative Boundaries), and added the Shapefile with the borders to the project repo: data/ukr-adm-sspe-20220131-zip-1/ukr_admbnda_adm1_sspe_20220114.shp.
regions = gpd.read_file(r'../data/ukr-adm-sspe-20220131-zip-1/ukr_admbnda_adm1_sspe_20220114.shp')regions.head(3)| Shape_Leng | Shape_Area | ADM1_EN | ADM1_UA | ADM1_RU | ADM1_PCODE | ADM1_REF | ADM1ALT1EN | ADM1ALT2EN | ADM1ALT1UA | ... | ADM1ALT1RU | ADM1ALT2RU | ADM0_EN | ADM0_UA | ADM0_RU | ADM0_PCODE | date | validOn | validTo | geometry | |
|---|---|---|---|---|---|---|---|---|---|---|---|---|---|---|---|---|---|---|---|---|---|
| 0 | 25.522335 | 2.931510 | Avtonomna Respublika Krym | Автономна Республіка Крим | Автономная Республика Крым | UA01 | None | None | None | None | ... | None | None | Ukraine | Україна | Украина | UA | 2021-11-09 | 2022-01-14 | None | MULTIPOLYGON (((35.37597 45.26085, 35.37507 45... |
| 1 | 12.326361 | 3.250424 | Vinnytska | Вінницька | Винницкая | UA05 | None | None | None | None | ... | None | None | Ukraine | Україна | Украина | UA | 2021-11-09 | 2022-01-14 | None | POLYGON ((28.87952 49.88847, 28.88087 49.88828... |
| 2 | 12.448772 | 2.590782 | Volynska | Волинська | Волынская | UA07 | None | None | None | None | ... | None | None | Ukraine | Україна | Украина | UA | 2021-11-09 | 2022-01-14 | None | POLYGON ((25.22584 51.96091, 25.22584 51.96091... |
3 rows × 21 columns
regions.to_crs(epsg=3857, inplace=True)ax = regions.plot(figsize=(20,10))
cx.add_basemap(ax)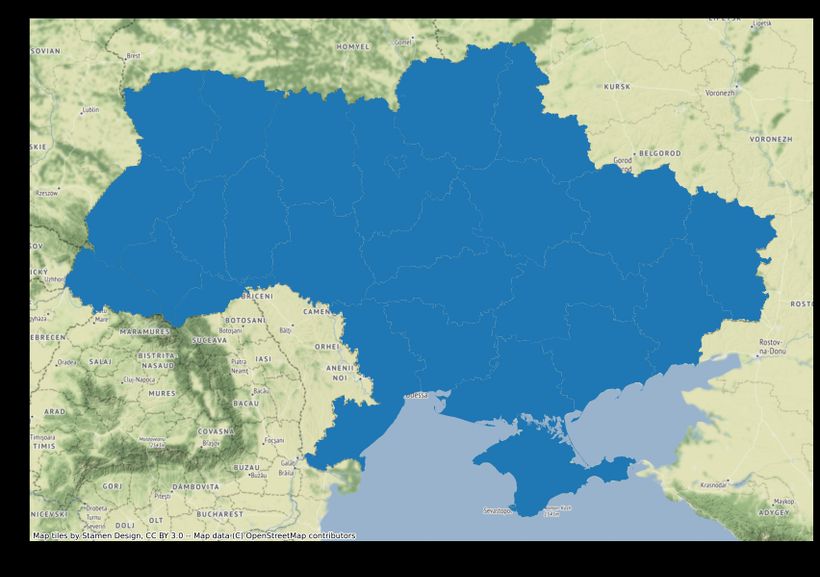
geo_incidents_df.crs == regions.crsTrue
combined_geo_incidents_df = gpd.sjoin(geo_incidents_df, regions[['ADM1_EN', 'geometry']], predicate='within').drop(columns=['index_right'])combined_geo_incidents_df.head(3)| id | date | latitude | longitude | location | area_type | description | geometry | ADM1_EN | |
|---|---|---|---|---|---|---|---|---|---|
| 0 | CIV0001 | 2022-02-24 | 49.850050 | 36.659031 | Chuhuiv, south of Kharkiv | Residential | Apartment block hit. Crater is very large, pos... | POINT (4080864.664 6420347.527) | Kharkivska |
| 12 | CIV0018 | 2022-02-25 | 49.987116 | 36.261098 | Kharkiv | Residential | Rocket motor lodged in a street at zebra cross... | POINT (4036566.965 6444044.858) | Kharkivska |
| 13 | CIV0019 | 2022-02-25 | 49.990482 | 36.267443 | Kharkiv | Residential | Another weapon remnant (also possibly from a B... | POINT (4037273.287 6444627.654) | Kharkivska |
Heatmap visualization
m = folium.Map(location=[49.107892273527504, 31.444630060047018], tiles = 'stamentoner', zoom_start=6, control_scale=True)

heat_data = list(zip(combined_geo_incidents_df["latitude"], combined_geo_incidents_df["longitude"]))

HeatMap(heat_data).add_to(m)

m
Analysing civilian harm by regions
incidents_by_region = combined_geo_incidents_df.groupby('ADM1_EN').size().to_frame(name='n_events').reset_index()incidents_by_region.head(2)| ADM1_EN | n_events | |
|---|---|---|
| 0 | Cherkaska | 1 |
| 1 | Chernihivska | 14 |
fig = px.pie(incidents_by_region, values='n_events', names='ADM1_EN', title='Civilian harm by region',
             hover_data=['n_events'], labels={'n_events':'Number of incidents', 'ADM1_EN': 'Region'})

fig.update_traces(textposition='inside', textinfo='percent+label')
fig.update_layout(uniformtext_minsize=12, uniformtext_mode='hide', width=800, height=600)

fig.show()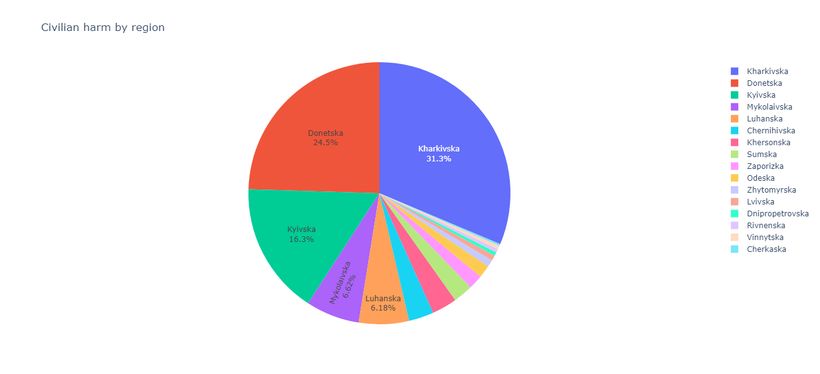
Choropleth classification
regions_incidents = pd.merge(regions[['ADM1_EN', 'geometry']], incidents_by_region, how='left', on='ADM1_EN')regions_incidents['n_events'] = regions_incidents['n_events'].fillna(0)regions_incidents.head(3)| ADM1_EN | geometry | n_events | |
|---|---|---|---|
| 0 | Avtonomna Respublika Krym | MULTIPOLYGON (((3938035.422 5662681.206, 39379... | 0.0 |
| 1 | Vinnytska | POLYGON ((3214853.149 6426982.914, 3215003.413... | 2.0 |
| 2 | Volynska | POLYGON ((2808127.132 6793060.793, 2808127.175... | 0.0 |
regions_incidents['geoid'] = regions_incidents.index.astype(str)m = folium.Map(location=[49.107892273527504, 31.444630060047018], tiles='cartodbpositron', zoom_start=6, control_scale=True)
folium.Choropleth(geo_data=regions_incidents,
data=regions_incidents,
name='Choropleth Map',
columns=['geoid','n_events'],
key_on='feature.id',
bins=8,
fill_color='YlOrRd',
line_color='white',
line_weight=0,
legend_name='Number of incidents').add_to(m)
folium.features.GeoJson(regions_incidents, name='Labels',
style_function=lambda x: {'color':'transparent','fillColor':'transparent','weight':0},
tooltip=folium.features.GeoJsonTooltip(fields=['ADM1_EN', 'n_events'],
aliases = ['Region', 'Number of incidents'],
labels=True,
sticky=True)).add_to(m)
folium.LayerControl().add_to(m)
m