The Architecture diagram
  • Full-stack Software Development
  • Infrastructure as Code & CI/CD (Terraform, GitHub Actions)
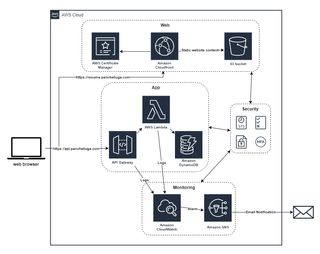
  • Cloud Services (AWS Lambda, API Gateway, DynamoDB, CloudFront, S3)
  • Networking (DNS, CDNs, Cloud Networking)
  • Testing and Monitoring (Cypress, CloudWatch)

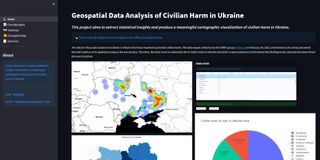
Cloud Resume Challenge: Showcasing My Cloud Expertise

This project unfolds as an exciting adventure into the cloud ecosystem, providing a detailed account of my experiences in full-stack software development, infrastructure as code, and cloud services.

My online resume
screenshot of the website - https://advocatherine.expert/
  • Jamstack (Eleventy - Static Site Generator)
  • Front-end (HTML, CSS, Javascript)
  • CI/CD (Netlify + GitHub)

Attorney at Law Website - Empowering Legal Excellence Online

This project spotlights the creation of a comprehensive website tailored to establish a commanding online presence, promote legal services, and share insightful perspectives through a dedicated blog.

Visit website
screenshot of the website application
  • Data munging (pandas/geopandas)
  • Statistical Data Visualization (plotly)
  • Interactive maps (folium)
  • Streamlit

Geospatial Data Analysis of Civilian Harm in Ukraine

The main idea of this project was to present the results of my previous work - Spatial Data Analysis of Civilian Harm in Ukraine, which was made in the Jupyter notebook, to a broad audience.

Launch app
Heatmap of incidents
  • Spatial Data Science
  • Jupyter Lab
  • Data munging (pandas/geopandas)
  • Statistical Data Visualization (plotly)
  • Interactive maps (folium)

Spatial Data Analysis of Civilian Harm in Ukraine

This project aims to extract statistical insights and produce a meaningful cartographic visualization of civilian harm in Ukraine. The data for this project based on incidents in Ukraine that have resulted in potential civilian harm. All computations were made in the Jupyter notebook, and I really like Jupyter for its ability to represent your work without additional storytelling in the article.

See repo
Times Series Animation of flood.
  • Google Earth Engine
  • SAR RGB visualization
  • SAR change detection
  • Sentinel-1/2 data
  • geemap - Python package

Flood Mapping and Damage Assessment

The main goal of this project was to implement my Google Earth Engine skills and dive deeper into SAR remote sensing analysis techniques. Using SAR data on flood mapping is a standard and reliable method for determining the extent of significant floods. The main advantage of using microwave data is that it can penetrate cloud cover, operate in any weather conditions, and provide timely and crucial information both day and night since it is not dependent on sunlight for reflectance.

Launch app

Let's talk

Want to work together or learn more about my work?

Email me